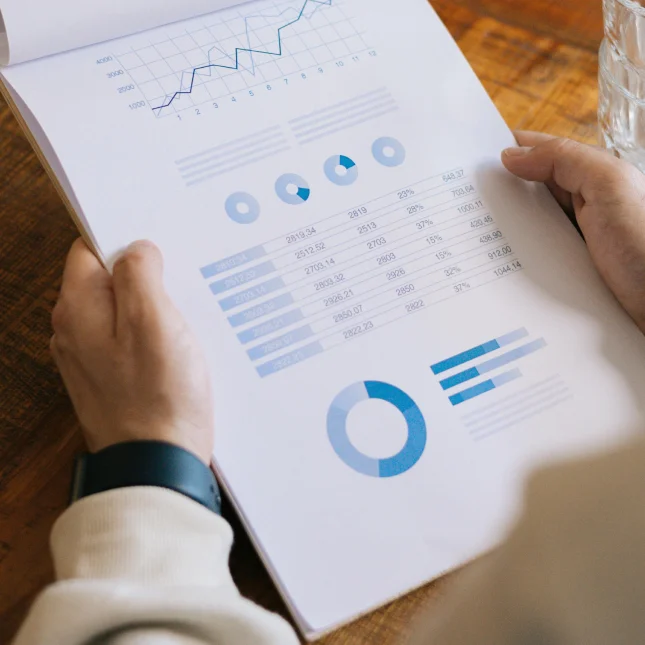
I turn data into clear, compelling visuals that help you win pitches and tell stronger business stories.
Let’s elevate your brand.
Professionally designed slides that captivate and persuade.
Clear, polished designs for internal and external stakeholders.
Story-driven graphics that make information more digestible.
Transform complex data into easy-to-understand infographics and charts.
From pitch decks to data visualizations, I turn complex information into visuals that resonate. Every project is built with your audience and goals in mind—so your message lands with clarity and confidence.

Ready to elevate your brand? Contact me today to discuss your project and discover how we can bring your vision to life.
I’m here to help! Let’s meet to discuss how we can make your business grow.
Let’s elevate your brand.
I create investor pitch decks, sales presentations, internal reports, keynote visuals, and more—each customized to your goals and audience.
Yes. I often work with clients to structure their messaging before designing slides. If needed, I can help clarify your story and key points for maximum impact.
Both. I can enhance an existing deck or create one from the ground up. Either way, the end result will be visually polished and strategically aligned with your goals.
Typically, I deliver decks in PowerPoint, Google Slides, or PDF format. I can also supply individual visuals or graphics separately if needed.
Absolutely. I specialize in transforming raw data into clean, engaging visuals—charts, infographics, and dashboards that make your insights easy to understand.
Timelines vary based on project scope. A small presentation might take 2–4 days, while larger decks or custom data visuals may take a week or more. I’ll give you a clear timeline upfront.
A rough outline of your content, any brand guidelines you follow, and a brief discussion about your goals. From there, I can guide the process.
Yes. I include a round (or two) of revisions depending on the project scope to ensure the final product aligns with your vision.